


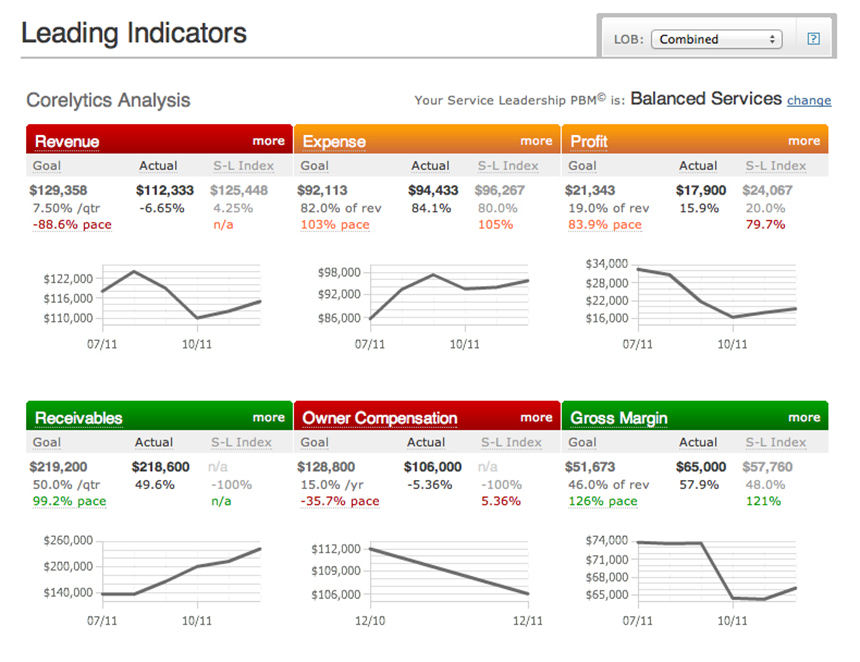
Corelytics is a powerful tool to swiftly analyze any business. The Corelytics dashboard normalizes data and uses predictive analytics to consolidate and compare company performance to industry benchmarks. In just a few minutes, you can prepare a detailed assessment of a company’s financial health by connecting to any existing accounting system. Monitor a single line of business or on a consolidated basis.

The Corelytics Dashboard anonymously aggregates industry data providing benchmarks available for you to compare within your industry and gain intelligence on the metrics most important to your business. Benchmarks provide valuable information about the performance and market behavior in a particular industry.
Some of these industries include:
Audio Visual | Information Technology | Agriculture & Food | Professional Services & Legal | Medical & Dental Clinics | Construction | Retail | Insurance
Once you begin reviewing your company’s financial performance, we can also assist you with reviewing your social media presence and with performing a comprehensive operational assessment of your Company.
Once you begin reviewing your company’s financial performance, we can also assist you with reviewing your social media presence and with performing a comprehensive operational assessment of your Company.
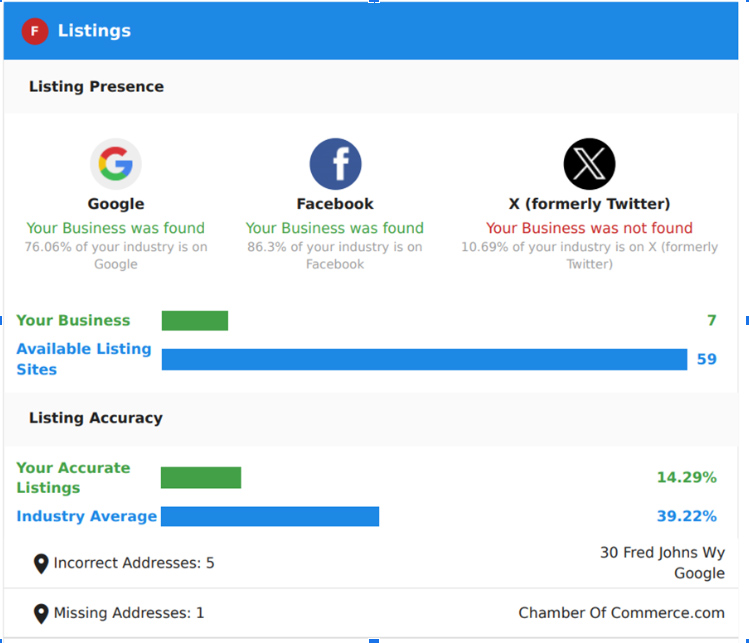
Want to know where you compare against your competitors in the social media landscape? Our digital media scan will provide you with the comparative metrics you need to understand your digital footprint and provide you with the data you need to improve your company’s digital awareness. Learn more…
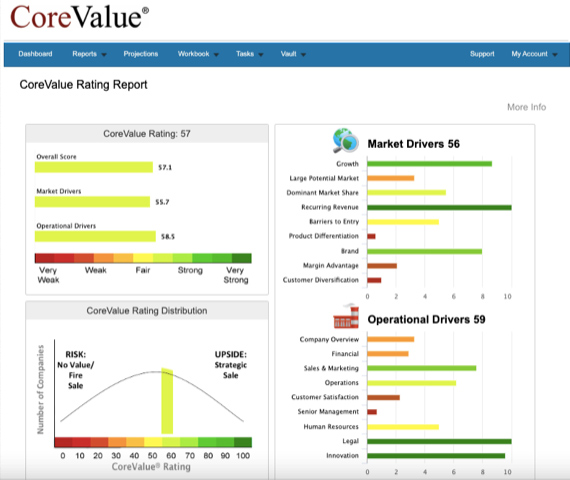
Corelytics provides a detailed operational assessment solution covering 18 critical areas of your company to give you the detail you need to make adjustments to your company’s operations to support growth and increase the value of your company. Learn more…